Intrusion detection systems (IDS) passively listen to network traffic via a network TAP or mirrored port in order to detect malicious activity or policy violations. Network metadata from the IDS is ingested into a security information and event management (SIEM) system, which is typically monitored by security analysts.
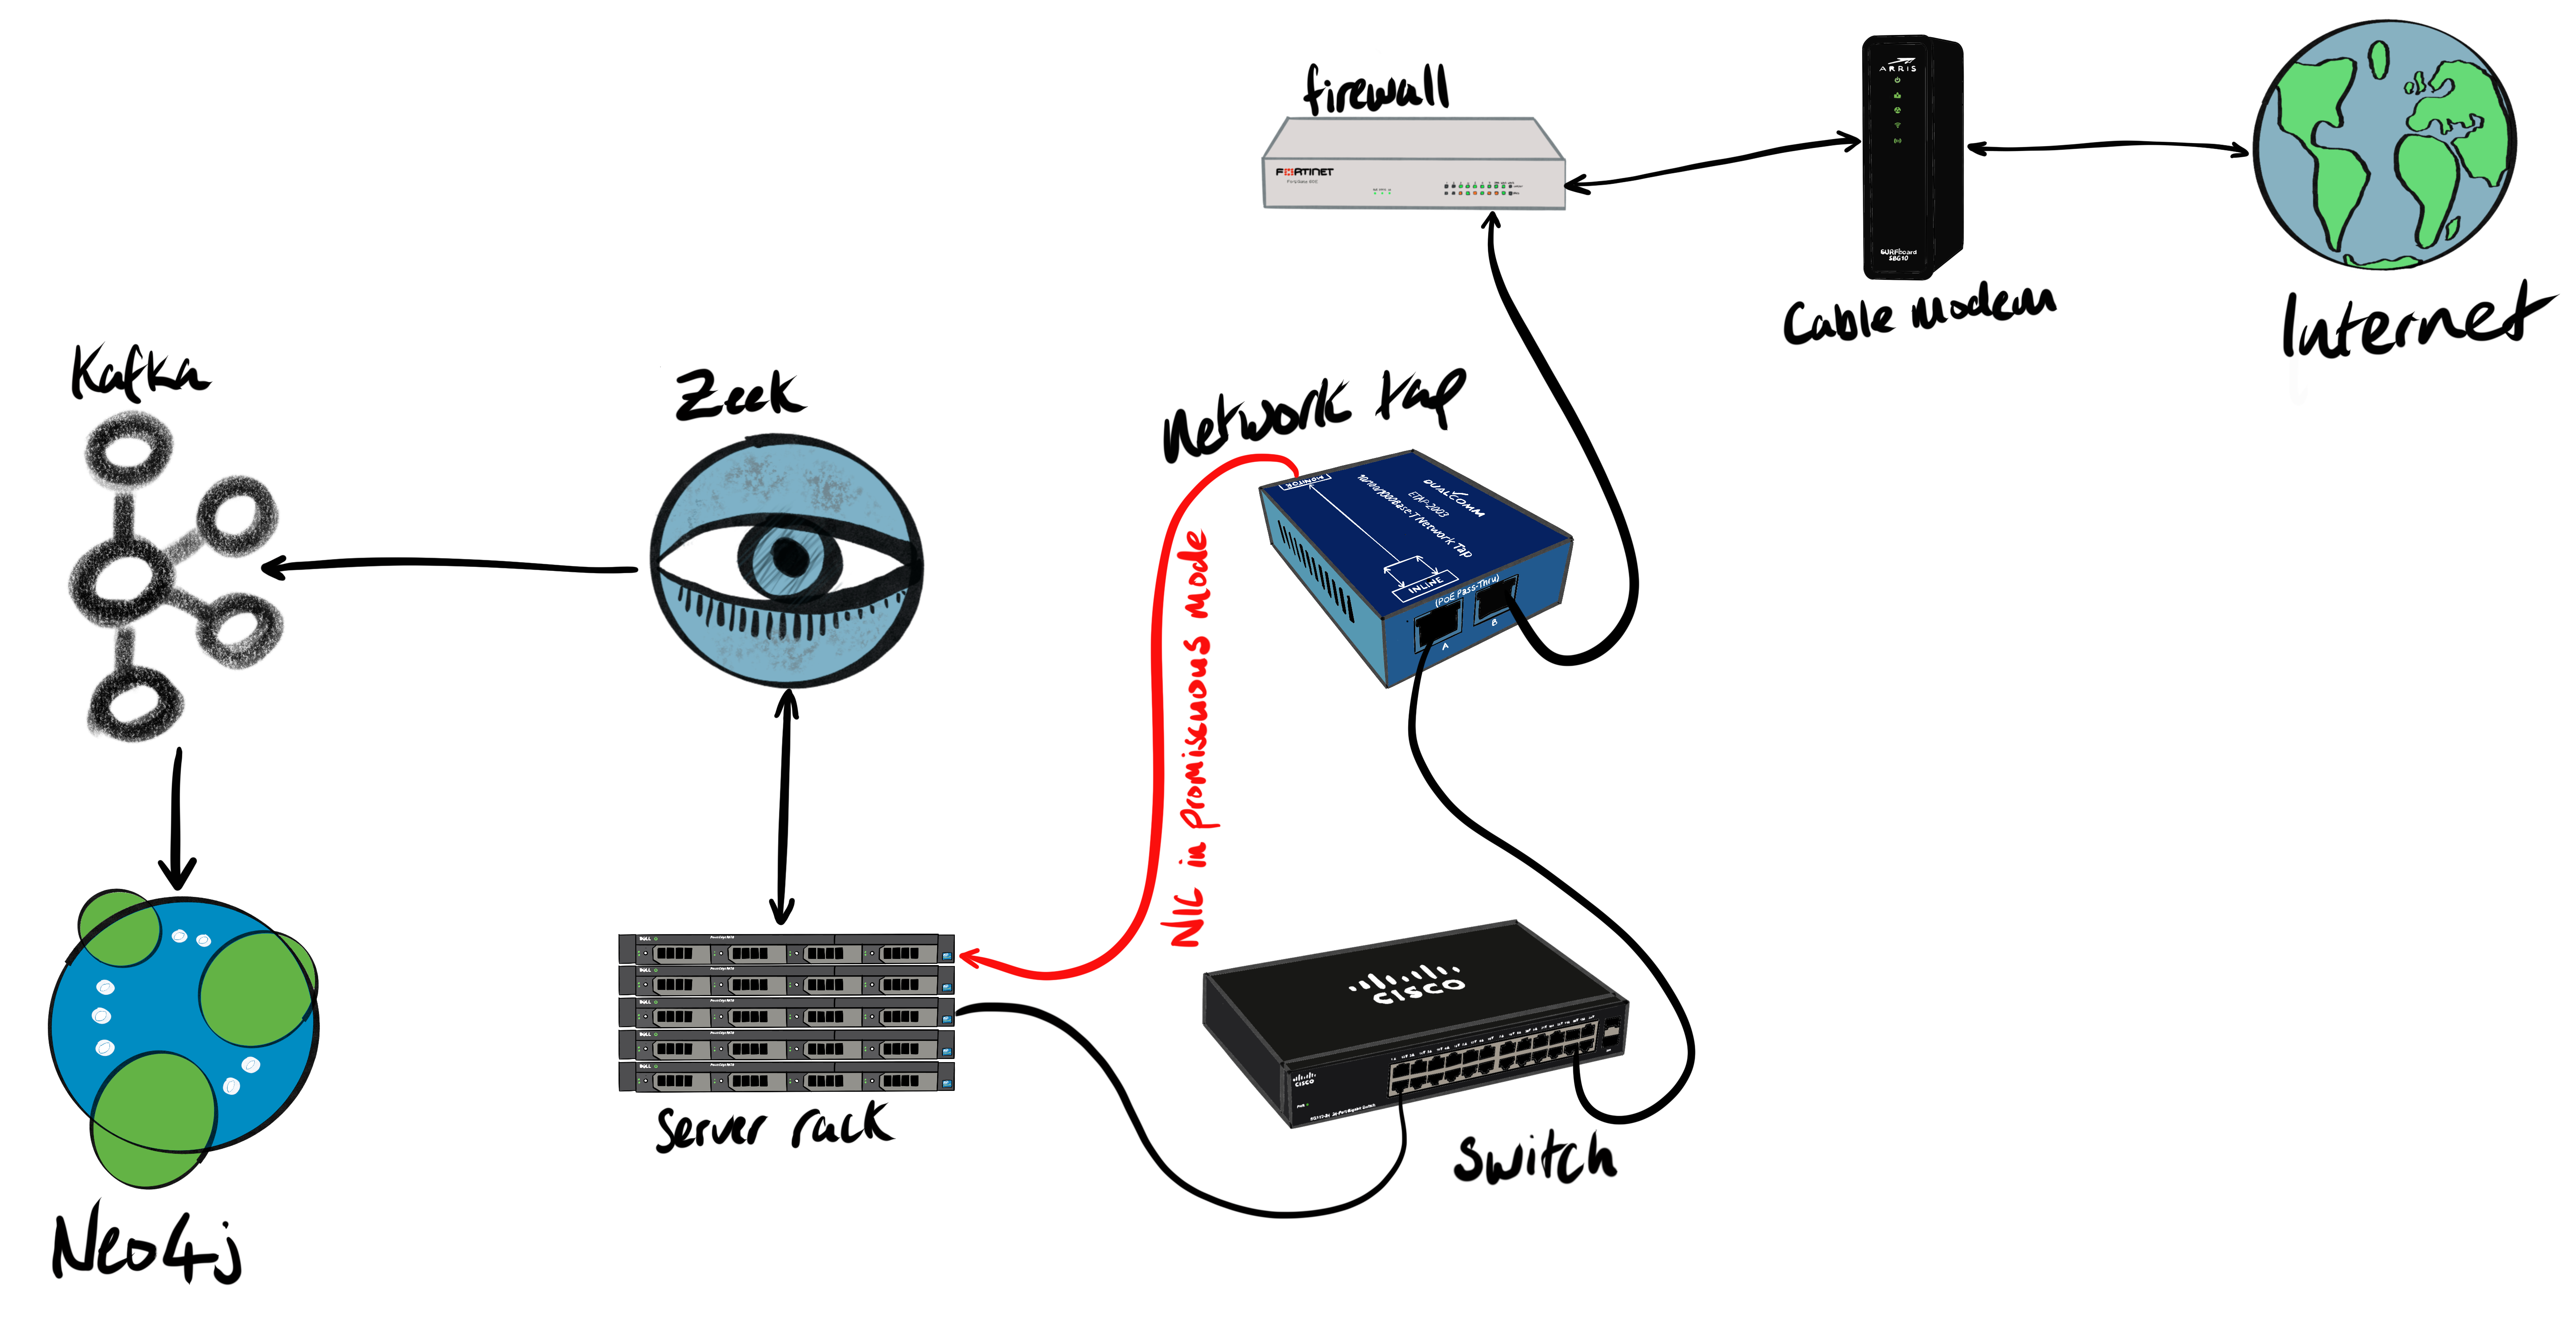
In my case, I placed a Dualcomm ETAP-2003 inline to send packets directly to a network port that’s listening in promiscuous mode. Then Zeek, an open-source network intrusion detection system, extracts metadata from those network packets and publishes that metadata in JSON format to Apache Kafka. Zeek’s protocol analyzers extract around 400 fields from 35 protocols.
The diagram shows how the various components are physically and logically connected.
In addition to extracting a plethora of metadata from network packets, Zeek can also publish data directly to Kafka via the Metron Bro Kafka plugin. Once the plugin has been installed, network metadata can be published to Kafka using the following configuration in the Zeek configuration file (located in /opt/zeek/share/site/local.zeek):
@load packages/metron-bro-plugin-kafka
redef Kafka::send_all_active_logs = T;
redef Kafka::topic_name = "";
redef Kafka::kafka_conf = table(
    ["metadata.broker.list"] = "cp01.woolford.io:9092,…”
);
Note that the topic_name property is an empty string. With this setting, each log type will be written to its own topic. For a complete list, check out the Zeek log files documentation.
Once the data has been landed in Kafka, it’s relatively simple to integrate with other systems via the Confluent Hub ecosystem, streaming GUI tools (e.g. StreamSets, Nifi, etc…), and streaming frameworks (e.g. Spark, Flink, Beam, etc…). At the time of writing, the Confluent Hub has over 100 connectors that can write to all sorts of databases (including SQL, columnar, document, cache, timeseries, GPU), change data capture tools (CDC), messaging systems, and file/storage technologies.
Elastic is a very popular destination for cybersecurity logs, mainly for its powerful search capabilities that enable threat-monitoring and threat-hunting. Out of the box, Zeek’s timestamp format isn’t recognised by Elastic. The following setting changed the timestamp format to Elastic-friendly epoch millis:
redef Kafka::json_timestamps = JSON::TS_MILLIS;
Apache Avro is a common data serialization format that has several advantages over JSON: most notably Avro has a compact format and supports schema management/evolution. By default, Zeek outputs some of the data with periods in the field names. This isn’t compatible with Avro. The following property replaces periods with Avro-friendly underscores:
redef Log::default_scope_sep = "_";
Here are a few of the more interesting Zeek log topics:
conn: TCP/UDP/ICMP connections between hostsdns: DNS activityssh: SSH connectionsssl: SSL/TLS handshake infofiles: analysis of filesx509: x509 certificate infosoftware: software being used on the network
In this article, we’ll show you how to analyze that network data in a graph database, specifically Neo4j. It seems natural to model a network as a graph since a network is a graph of nodes (hosts) and edges (connections).
Neo4j is a graph database that, in addition to having a very intuitive query language (Cypher), has bi-directional Kafka connectivity. It really couldn’t be much simpler. To build the real-time graph of network connectivity, we downloaded the latest neo4j-streams, copied it to Neo4j’s plugins folder, added some properties to neo4j.conf, and restarted the service.
# Connect to Kafka
kafka.zookeeper.connect=zk01.woolford.io:2181,zk02.woolford.io:2181,zk03.woolford.io:2181
kafka.bootstrap.servers=cp01.woolford.io:9092,cp02.woolford.io:9092,cp03.woolford.io:9092
kafka.auto.offset.reset=latest
kafka.group.id=neo4j
kafka.enable.auto.commit=true
kafka.key.deserializer=org.apache.kafka.common.serialization.ByteArrayDeserializer
kafka.value.deserializer=org.apache.kafka.common.serialization.ByteArrayDeserializer

# Cypher query to build graph
streams.sink.enabled=true
streams.sink.topic.cypher.conn=MERGE (origin:IP {id: event.id_orig_h}) MERGE (response:IP {id: event.id_resp_h}) MERGE (origin)-[connectedTo:CONNECTED_TO]->(response) ON CREATE SET connectedTo.connections = 1 ON MATCH SET connectedTo.connections = connectedTo.connections + 1 ON CREATE SET origin.orig_bytes = event.orig_bytes ON MATCH SET origin.orig_bytes = origin.orig_bytes + event.orig_bytes ON CREATE SET response.resp_bytes = event.resp_bytes ON MATCH SET response.resp_bytes = response.resp_bytes + event.resp_bytes
We used the Zeek conn log topic. Here’s a sample record:
{
  "ts": 1576218810003,
  "uid": "CCbJfY2T52zPUgmtJg",
  "id_orig_h": "10.0.1.10",
  "id_orig_p": 36070,
  "id_resp_h": "104.18.2.30",
  "id_resp_p": 80,
  "proto": "tcp",
  "service": "http",
  "duration": 0.054221153259277344,
  "orig_bytes": 271,
  "resp_bytes": 6156,
  "conn_state": "RSTO",
  "local_orig": true,
  "local_resp": false,
  "missed_bytes": 0,
  "history": "ShADadR",
  "orig_pkts": 7,
  "orig_ip_bytes": 571,
  "resp_pkts": 8,
  "resp_ip_bytes": 6488,
  "resp_cc": "US",
  "resp_lat": 37.751,
  "resp_long": -97.822
}
The id_orig_h is the IP address of the originating endpoint, and id_resp_h is the IP address of the responding endpoint. For field definitions see this cheat sheet.
So now we understand the data, let’s take a look at the Cypher query that builds the graph in more detail:
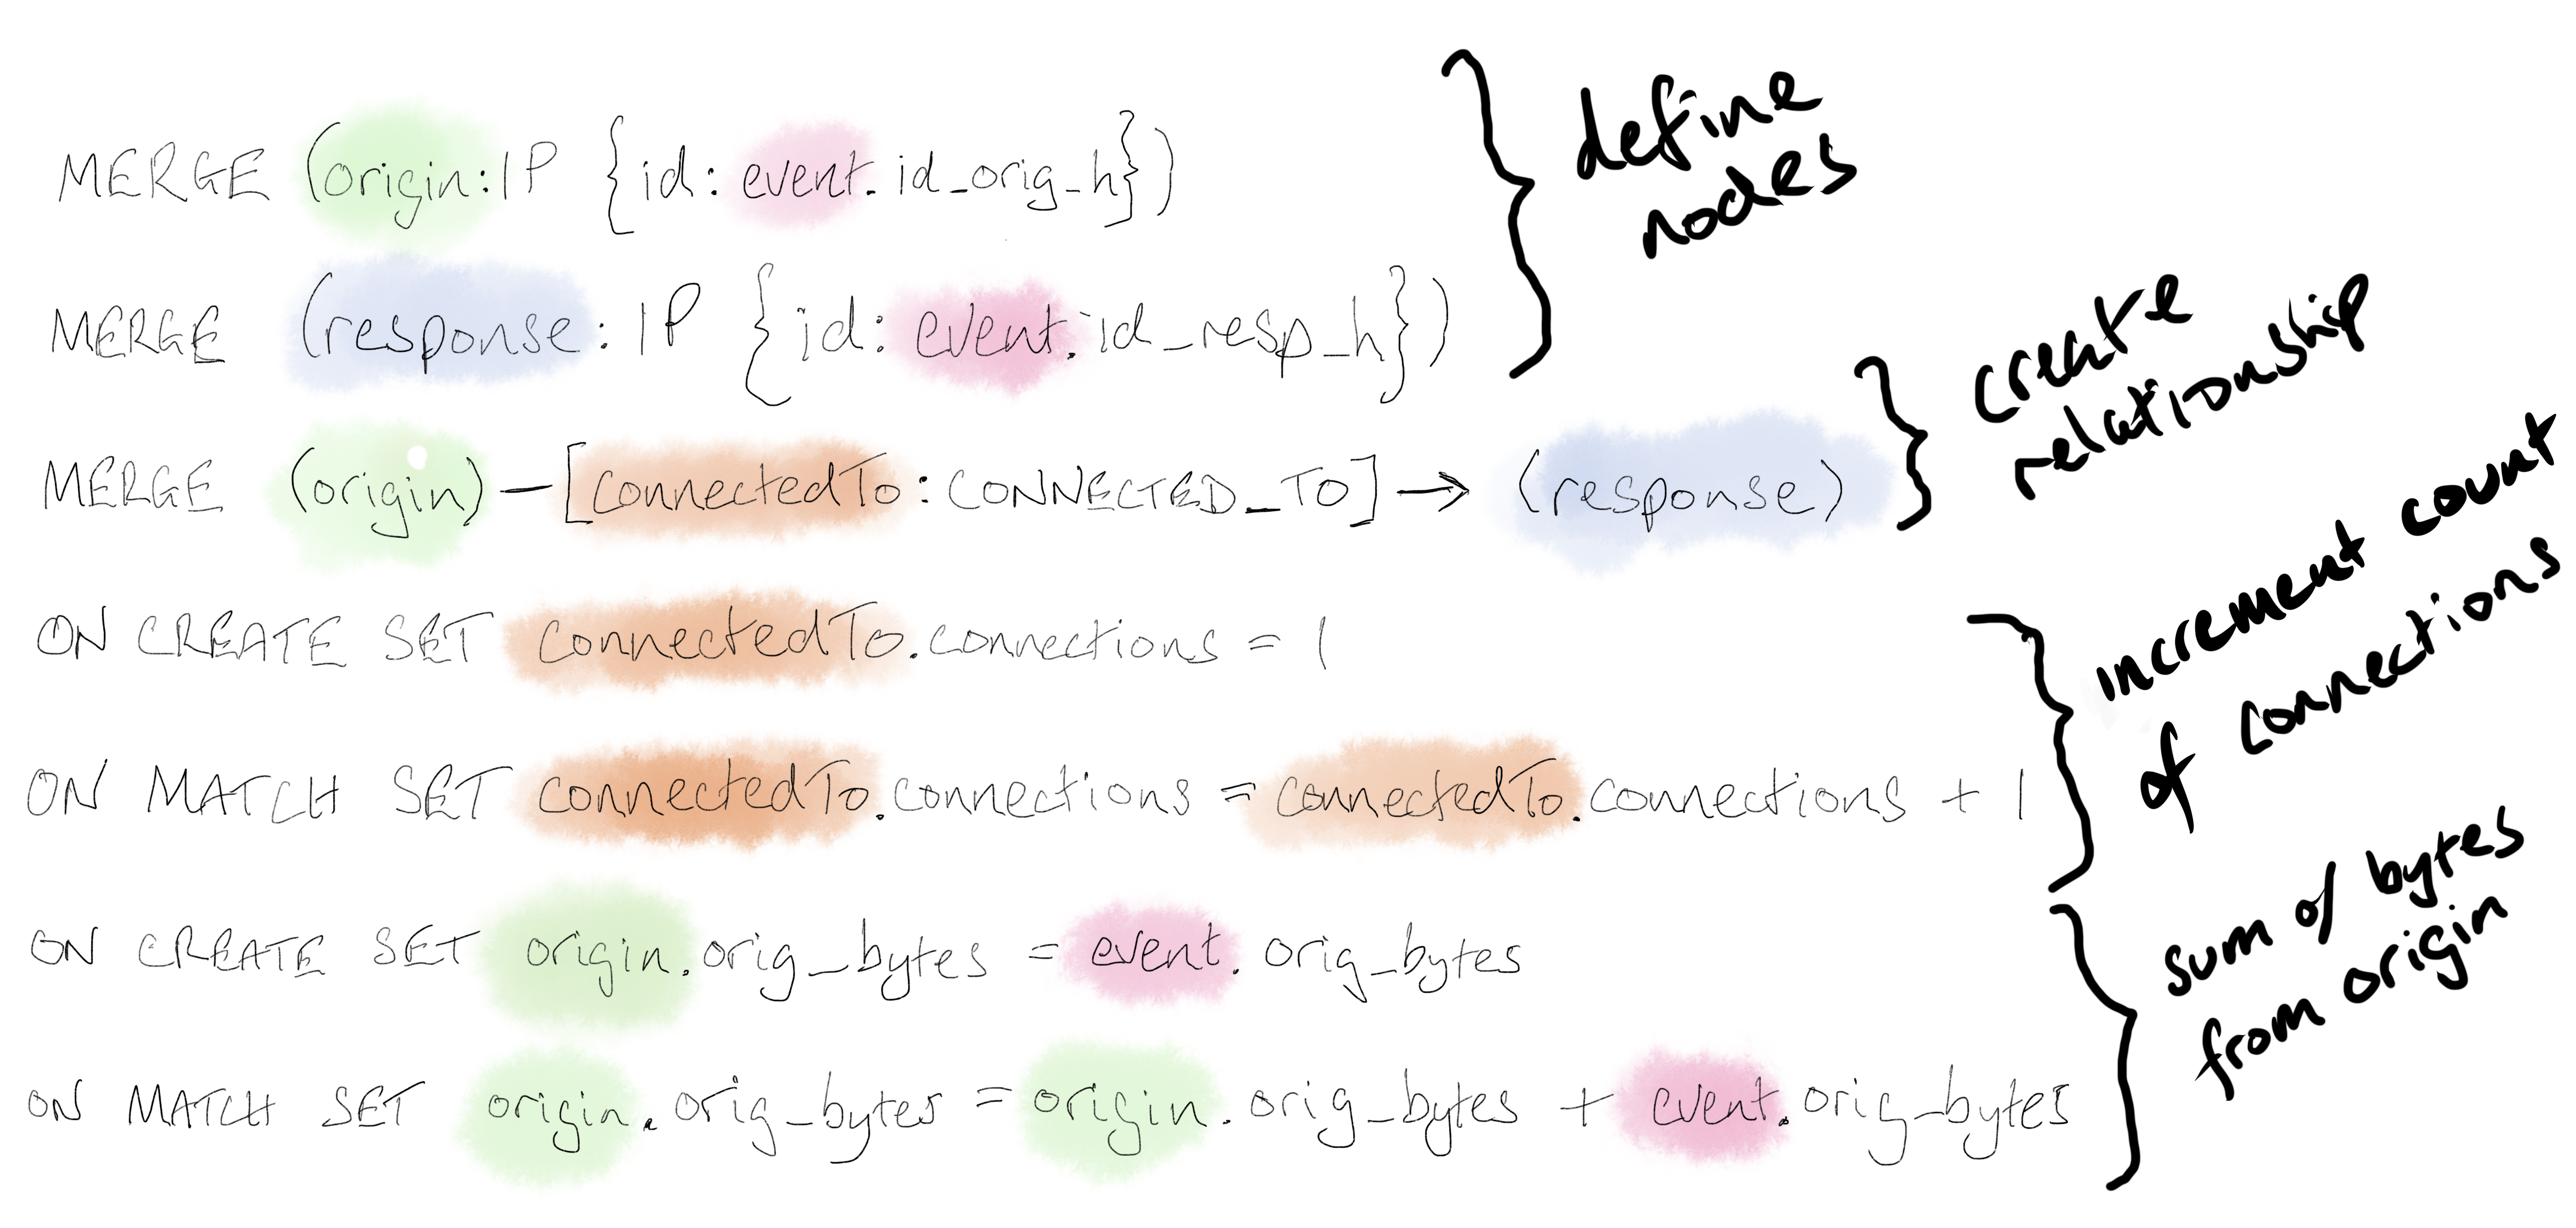
We’ve added some color coding to help make the Cypher statement easier to understand. The merge is an upsert for a node in the graph. Each event, highlighted in pink, is set as a property to the nodes in the Cypher statement. Attributes of the event can be accessed with a period (i.e. .). For example, event.id_orig_h is the originating IP address of that event. We assign properties from the event to the origin and response nodes, and then create a directional relationship between those nodes. In addition to defining the nodes/edges, we captured counts for each connection and a sum of the bytes sent from each origin.
Neo4j has a (large) number of graph algorithms to help make sense of the data. We downloaded the latest Neo4j graph algorithms jar from the the Neo4j download center, copied it into the plugins folder, and added the following line to neo4j.conf:
dbms.security.procedures.unrestricted=algo.*
Once Neo4j had been restarted, we were able to add two additional attributes to the graph:
# add degree of centrality
CALL algo.degree("IP", "CONNECTED_TO", {direction: "both", writeProperty: "degree"})

# add Louvain community
CALL algo.louvain("IP", "CONNECTED_TO", {write:true, writeProperty: "community"})
The degree of centrality is a measure of the number of edges connected to a given node. This enables us to identify hosts that are talking to a lot of devices on the network. On my network, these are hosts with heavy internet use.
The Louvain community detection algorithm groups similar nodes together. After the Louvain community detection algorithm has been run, each node has a community ID property added to it. The visualization below shows the graph of connections to hosts on my local network and the color represents the community.
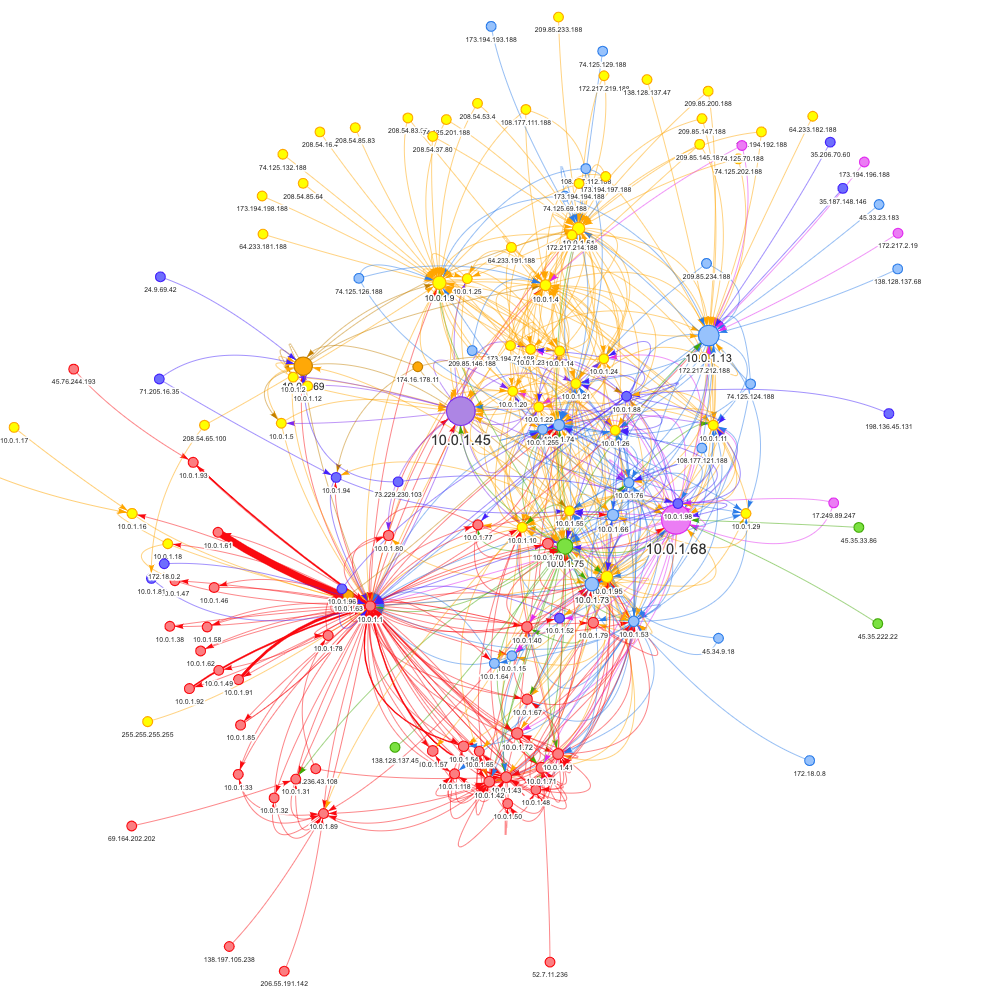
The Neo4j Browser works really well for small datasets (i.e. < 300 nodes). For larger graphs, it’s necessary to visualize using something else. This visualization was created with Neovis.js.
Here’s the HTML for the Neovis visualization:
<!doctype html>
<html>
<head>
    <title>Zeek connections</title>
    <style type="text/css">
        html, body {
            font: 16pt arial;
        }
        #viz {
            width: 900px;
            height: 900px;
            border: 1px solid lightgray;
            font: 22pt arial;
        }
    </style>

    <!-- FIXME: load from dist -->
    <!-- <script type="text/javascript" src="../dist/neovis.js"></script> -->
    <script type="text/javascript" src="https://rawgit.com/neo4j-contrib/neovis.js/master/dist/neovis.js"></script>

    <script
            src="https://code.jquery.com/jquery-3.2.1.min.js"
            integrity="sha256-hwg4gsxgFZhOsEEamdOYGBf13FyQuiTwlAQgxVSNgt4="
            crossorigin="anonymous"></script>

    <script type="text/javascript">
        // define config car
        // instantiate nodevis object
        // draw
        var viz;
        function draw() {
            var config = {
                container_id: "viz",
                server_url: "bolt://neo4j.woolford.io:7687",
                server_user: "neo4j",
                server_password: "neo4j",
                labels: {
                    "IP": {
                        "caption": "id",
                        "size": "degree",
                        "community": "community"
                    }
                },
                relationships: {
                    "CONNECTED_TO": {
                        "thickness": "connections",
                        "caption": false
                    }
                },
                initial_cypher: "MATCH (x)-[y:CONNECTED_TO]->(z) RETURN *",
                arrows: true
            };
            viz = new NeoVis.default(config);
            viz.render();
            console.log(viz);
        }
    </script>
</head>
<body onload="draw()">
<div id="viz"></div>

Cypher query: <textarea rows="4" cols=50 id="cypher"></textarea><br>
<input type="submit" value="Submit" id="reload">
<input type="submit" value="Stabilize" id="stabilize">

</body>

<script>
    $("#reload").click(function() {
        var cypher = $("#cypher").val();
        if (cypher.length > 3) {
            viz.renderWithCypher(cypher);
        } else {
            console.log("reload");
            viz.reload();
        }
    });
    $("#stabilize").click(function() {
        viz.stabilize();
    })
</script>
</html>
Graph analysis is a very powerful technique for a cybersecurity analyst to understand what’s happening on the network.
This worked really well in my local network. In high-throughput environment, we’d recommend that you pre-aggregate events before writing them to Neo4j. This would be simple to do in KSQLdb or Kafka Streams.
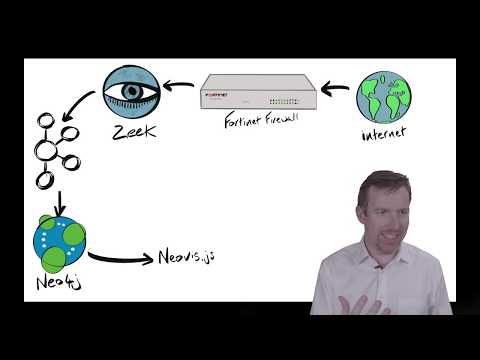
Here’s a video walk-through of the end-to-end solution: